A) the y-variable increases.
B) the y-variable decreases.
C) the y-variable stays the same.
D) the x-variable can never be positive.
F) A) and C)
Correct Answer

verified
Correct Answer
verified
Multiple Choice
Economists speaking like policy advisers make
A) positive statements.
B) descriptive statements.
C) claims about how the world is.
D) claims about how the world should be.
F) A) and C)
Correct Answer

verified
Correct Answer
verified
True/False
Assumptions can simplify the complex world and make it easier to understand.
B) False
Correct Answer

verified
Correct Answer
verified
Multiple Choice
Figure 2-14 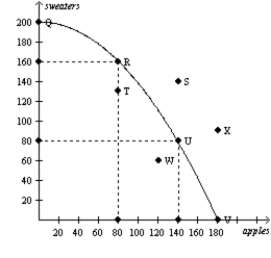 Consider the production possibilities curve for a country that can produce sweaters, apples (in bushels) , or a combination of the two.
-Refer to Figure 2-14. The opportunity cost of moving from point U to point R is
A) 60 bushels of apples.
B) 80 bushels of apples.
C) 80 sweaters.
D) 160 sweaters.
F) B) and C)
Correct Answer

verified
Correct Answer
verified
Multiple Choice
Almost all economists agree that local and state governments should
A) eliminate subsidies to professional sports franchises.
B) increase subsidies to professional sports franchises.
C) copy economic policy from Washington, D.C.
D) prevent companies from outsourcing work.
F) None of the above
Correct Answer

verified
Correct Answer
verified
Multiple Choice
A macroeconomist - as opposed to a microeconomist - would study
A) the effects of rent control on housing in New York City.
B) the effects of foreign competition on the US auto industry.
C) the effects of borrowing by the federal government.
D) the effects of raising the gasoline tax on transit ridership.
F) C) and D)
Correct Answer

verified
Correct Answer
verified
Multiple Choice
A positive economic statement such as "Pollution taxes decrease the quantity of pollution generated by firms"
A) would likely be made by an economist acting as a policy advisor.
B) would require values and data to be evaluated.
C) would require data but not values to be evaluated.
D) could not be evaluated by economists acting as scientists.
F) A) and D)
Correct Answer

verified
Correct Answer
verified
Multiple Choice
Which of the following is not held constant when looking at an individual's demand curve?
A) income
B) price
C) preferences
D) the availability of alternative goods
F) A) and C)
Correct Answer

verified
Correct Answer
verified
Short Answer
In the markets for goods and services in the circular flow diagram, households act as
Correct Answer

verified
Correct Answer
verified
Multiple Choice
Figure 2-9
Panel (a) Panel (b) 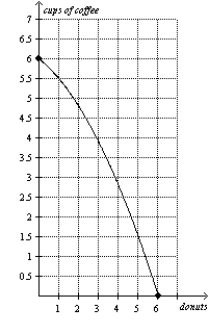
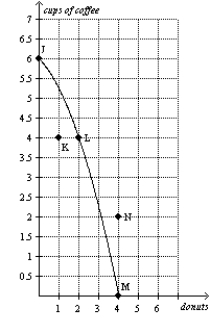 -Refer to Figure 2-9, Panel (a) . The movement from point M to point K could be caused by
A) an advance in production technology.
B) an improvement in efficiency.
C) economic growth.
D) unemployment.
F) B) and C)
Correct Answer

verified
Correct Answer
verified
True/False
"Other things equal, an increase in supply causes a decrease in price" is a normative statement, not a positive statement.
B) False
Correct Answer

verified
Correct Answer
verified
Multiple Choice
A statement describing how the world should be
A) is a normative statement.
B) is a positive statement.
C) would only be made by an economist speaking as a scientist.
D) would only be made by an economist employed by the government.
F) A) and B)
Correct Answer

verified
Correct Answer
verified
Multiple Choice
Which of the following is not correct?
A) When developing economic theories, graphs offer a way to visually express ideas that might be less clear if described with equations or words.
B) Graphs are one way of expressing the relationships among variables.
C) When studying the relationship between two economic variables, graphs allow economists to draw indisputable conclusions about causes and effects.
D) When analyzing economic data, graphs provide a powerful way of finding and interpreting patterns.
F) A) and D)
Correct Answer

verified
Correct Answer
verified
Multiple Choice
Figure 2-10
Panel (a) Panel (b) 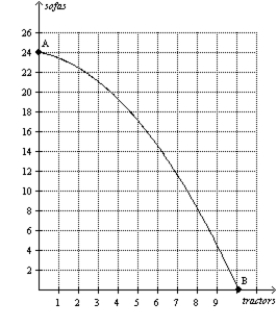
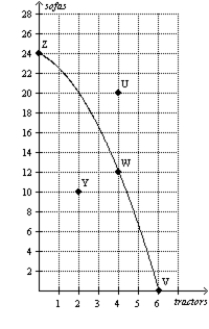 -Refer to Figure 2-10, Panel (a) and Panel (b) . Which of the following is not a result of the shift of the economy's production possibilities frontier from Panel (a) to Panel (b) ?
A) The tradeoff between the production of tractors and sofas changes.
B) Production of 2 tractors and 10 sofas becomes efficient.
C) Production of 6 tractors and 14 sofas becomes possible.
D) The opportunity cost of a sofa is higher at all levels of sofa production.
F) C) and D)
Correct Answer

verified
Correct Answer
verified
Multiple Choice
The x-coordinate is the
A) first number of an ordered pair and represents the point's horizontal location.
B) second number of an ordered pair and represents the point's horizontal location.
C) first number of an ordered pair and represents the point's vertical location.
D) second number of an ordered pair and represents the point's vertical location.
F) A) and B)
Correct Answer

verified
Correct Answer
verified
Short Answer
Table 2-6  -Refer to Table 2-6. Consider the production possibilities table for an economy that produces only mobile phones and pizzas. What is the opportunity cost of increasing production of pizzas from 4,000 to 6,000?
Correct Answer

verified
Correct Answer
verified
Multiple Choice
In the circular-flow diagram, which of the following items flows from firms to households through the markets for the factors of production?
A) goods and services
B) land, labor, and capital
C) dollars spent on goods and services
D) wages, rent, and profit
F) B) and D)
Correct Answer

verified
Correct Answer
verified
Multiple Choice
In the ordered pair (3, 6) , 3 is the
A) x-coordinate.
B) y-coordinate.
C) origin.
D) slope.
F) A) and B)
Correct Answer

verified
Correct Answer
verified
Multiple Choice
For economists, statements about the world are of two types:
A) assumptions and theories.
B) true statements and false statements.
C) specific statements and general statements.
D) positive statements and normative statements.
F) C) and D)
Correct Answer

verified
Correct Answer
verified
Multiple Choice
Figure 2-10
Panel (a) Panel (b) 
 -Refer to Figure 2-10, Panel (a) . Production at point Y is
A) impossible and inefficient.
B) impossible but efficient.
C) possible but inefficient.
D) possible and efficient.
F) A) and C)
Correct Answer

verified
Correct Answer
verified
Showing 561 - 580 of 617
Related Exams