Correct Answer

verified
Correct Answer
verified
Multiple Choice
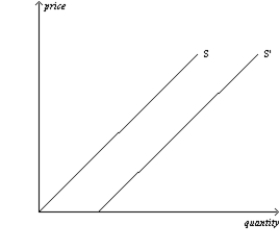
Figure 4-16  -Refer to Figure 4-16. The shift from S to S' is called a(n)
A) decrease in supply.
B) decrease in quantity supplied.
C) increase in supply.
D) increase in quantity supplied.
F) All of the above
Correct Answer

verified
Correct Answer
verified
Short Answer
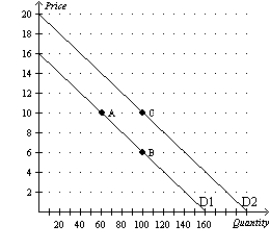
Figure 4-28  -Refer to Figure 4-28. Using the points on the figure, describe the change that would occur if consumer incomes increase and this is an inferior good.
Correct Answer

verified
Correct Answer
verified
Multiple Choice
Suppose that a decrease in the price of good X results in fewer units of good Y being demanded. This implies that X and Y are
A) complementary goods.
B) normal goods.
C) inferior goods.
D) substitute goods.
F) None of the above
Correct Answer

verified
Correct Answer
verified
Multiple Choice
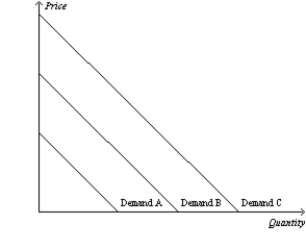
Figure 4-5  -Refer to Figure 4-5. Which of the following would cause the demand curve to shift from Demand B to Demand A in the market for oranges in the United States?
A) a freeze in Florida
B) a technological advance that allows oranges to ripen faster
C) a decrease in the price of apples
D) an announcement by the FDA that oranges prevent heart disease
F) All of the above
Correct Answer

verified
Correct Answer
verified
Multiple Choice
At the equilibrium price, the quantity of the good that buyers are willing and able to buy
A) is greater than the quantity that sellers are willing and able to sell.
B) exactly equals the quantity that sellers are willing and able to sell.
C) is less than the quantity that sellers are willing and able to sell.
D) Either a) or c) could be correct.
F) All of the above
Correct Answer

verified
Correct Answer
verified
Multiple Choice
When it comes to people's tastes, economists generally believe that
A) tastes are based on forces that are well within the realm of economics.
B) tastes are based on historical and psychological forces that are beyond the realm of economics.
C) tastes can only be studied through well-constructed, real-life models.
D) because tastes do not directly affect demand, there is little need to explain people's tastes.
F) C) and D)
Correct Answer

verified
Correct Answer
verified
Multiple Choice
Which of the following is not a characteristic of a perfectly competitive market?
A) Different sellers sell identical products.
B) There are many sellers.
C) Sellers must accept the price the market determines.
D) All of the above are characteristics of a perfectly competitive market.
F) C) and D)
Correct Answer

verified
Correct Answer
verified
Multiple Choice
A market supply curve shows how the total quantity supplied of a good varies as
A) production technology varies.
B) price varies.
C) input prices vary.
D) demand varies.
F) B) and C)
Correct Answer

verified
Correct Answer
verified
Multiple Choice
Which of the following changes would not shift the supply curve for a good or service?
A) a change in production technology
B) a change in the price of the good or service
C) a change in expectations about the future price of the good or service
D) a change in input prices
F) A) and C)
Correct Answer

verified
Correct Answer
verified
True/False
In a market economy, prices are the signals that guide the allocation of scarce resources.
B) False
Correct Answer

verified
Correct Answer
verified
Multiple Choice
The following table contains a demand schedule for a good.  If the law of demand applies to this good, then Q1 could be
A) 0.
B) 100.
C) 200.
D) 400.
F) B) and C)
Correct Answer

verified
Correct Answer
verified
Multiple Choice
If suppliers expect the price of their product to fall in the future, then they will
A) decrease supply now.
B) increase supply now.
C) decrease supply in the future but not now.
D) increase supply in the future but not now.
F) B) and C)
Correct Answer

verified
Correct Answer
verified
Multiple Choice
Beef is a normal good. You observe that both the equilibrium price and quantity of beef have fallen over time. Which of the following explanations would be most consistent with this observation?
A) Consumers have experienced an increase in income, and beef-production technology has improved.
B) The price of chicken has risen, and the price of steak sauce has fallen.
C) New medical evidence has been released that indicates a negative correlation between a person's beef consumption and life expectancy.
D) The demand curve for beef must be positively sloped.
F) A) and B)
Correct Answer

verified
Correct Answer
verified
Multiple Choice
Assume Leo buys coffee beans in a competitive market. It follows that
A) Leo has a limited number of sellers from which to buy coffee beans.
B) Leo will negotiate with sellers whenever he buys coffee beans.
C) Leo cannot influence the price of coffee beans even if he buys a large quantity of them.
D) None of the above is correct.
F) B) and D)
Correct Answer

verified
Correct Answer
verified
Multiple Choice
Figure 4-16  -Refer to Figure 4-16. If the supply curves that are drawn represent supply curves for single-family residential houses, then the movement from S to S' could be caused by a(n)
A) increase in the price of apartments which are a substitute for single-family houses for many people looking for a place to live.
B) newly-formed expectation by house-builders that prices of houses will increase significantly in the next six months.
C) decrease in the price of lumber.
D) All of the above are correct.
F) A) and D)
Correct Answer

verified
Correct Answer
verified
Multiple Choice
Table 4-7
 -Refer to Table 4-7. If these are the only four sellers in the market for ice cream, then when the price decreases from $10 to $8, the market quantity supplied decreases by
A) 2.5 gallons.
B) 4 gallons.
C) 10 gallons.
D) 50 gallons.
F) All of the above
Correct Answer

verified
Correct Answer
verified
Multiple Choice
Table 4-1
 -Refer to Table 4-1. Which of the following illustrates the market demand curve?
A) ![]()
B) ![]()
C) ![]()
D) ![]()
F) A) and C)
Correct Answer

verified
Correct Answer
verified
True/False
A decrease in supply shifts the supply curve to the left.
B) False
Correct Answer

verified
Correct Answer
verified
Multiple Choice
Table 4-11
 -Refer to Table 4-11. If the price were $4, a
A) surplus of 15 units would exist, and price would tend to fall.
B) shortage of 25 units would exist, and price would tend to rise.
C) surplus of 25 units would exist, and price would tend to fall.
D) shortage of 40 units would exist, and price would tend to rise.
F) None of the above
Correct Answer

verified
Correct Answer
verified
Showing 101 - 120 of 698
Related Exams